
Prof. ST Hsieh
Director, US-China Energy Industry Forum
626-376-7460
July 29, 2022
The accomplishment of US LNG export industry is significant as the attached report from US DOE clearly shows. It is such a contrast that around 2005, less than 20 years ago, the US was a major LNG importer, and many LNG receiving terminals were planned or under construction. The success of US shale oil/gas revolution around 2010 completely changed the landscape of global energy markets, the US became a net energy exporter; when President Trump (2016-2020) took office in 2016, he announced that US energy dominance or US Energy First. Specifically, as the following graph shows, US started to export LNG in 2016. After merely six years now US is the world’s largest LNG exporter. Amazing!
US shale oil and gas industry, unfortunately, were subdued during the Obama administration (2008-2016). Under Biden administration (2020-), the recovery is still in doubt. Obviously, the war in Ukraine, started on February 24, 2022, provided the big break for US LNG industry.
The war in Ukraine is all about Russian energy supply dominance over Europe. But, Europe’s over aggressive strategy of waning Russian gas supply via pipelines, US LNG is now Europe’s only energy supply lifeline.
But the infrastructure for US LNG export and import in Europe needs heavy investments and time.
Two points in mind:
- In the near term, how will EU nations get thru this winter without an economic crisis?
- Overall energy cost for Europeans will increase from now on!
JULY 25, 2022
The United States became the world’s largest LNG exporter in the first half of 2022
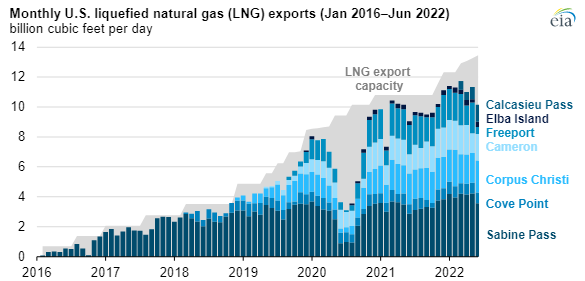
Data source: U.S. Energy Information Administration, Liquefaction Capacity Table, and U.S. Department of Energy LNG reports
Note: June 2022 LNG exports are EIA estimates based on tanker shipping data. LNG export capacity is an estimated peak LNG production capacity of all operational U.S. LNG export facilities.
Reposted July 26 to correct footnotes and minor text edits.
The United States became the world’s largest liquefied natural gas (LNG) exporter during the first half of 2022, according to data from CEDIGAZ. Compared with the second half of 2021, U.S. LNG exports increased by 12% in the first half of 2022, averaging 11.2 billion cubic feet per day (Bcf/d). U.S. LNG exports continued to grow for three reasons—increased LNG export capacity, increased international natural gas and LNG prices, and increased global demand, particularly in Europe.
According to our estimates, installed U.S. LNG export capacity has expanded by 1.9 Bcf/d nominal (2.1 Bcf/d peak) since November 2021. The capacity additions included a sixth train at the Sabine Pass LNG, 18 new mid-scale liquefaction trains at the Calcasieu Pass LNG, and increased LNG production capacity at Sabine Pass and Corpus Christi LNG facilities. As of July 2022, we estimate that U.S. LNG liquefaction capacity averaged 11.4 Bcf/d, with a shorter-term peak capacity of 13.9 Bcf/d.
International natural gas and LNG prices hit record highs in the last quarter of 2021 and first half of 2022. Prices at the Title Transfer Facility (TTF) in the Netherlands have been trading at record highs since October 2021. TTF averaged $30.94 per million British thermal units (MMBtu) during the first half of 2022. LNG spot prices in Asia have also been high, averaging $29.50/MMBtu during the same period.
Since the end of last year, countries in Europe have increasingly imported more LNG to compensate for lower pipeline imports from Russia and to fill historically low natural gas storage inventories. LNG imports in the EU and UK increased by 63% during the first half of 2022 to average 14.8 Bcf/d.
Most U.S. LNG exports went to the EU and the UK during the first five months of this year, accounting for 64%, or 7.3 Bcf/d, of the total U.S. LNG exports. Similar to 2021, the United States sent the most LNG to the EU and UK during the first half of the year, providing 47% of the 14.8 Bcf/d of Europe’s total LNG imports, followed by Qatar at 15%, Russia at 14%, and four African countries combined at 17%.
In June, the United States exported 11% less LNG than the 11.4 Bcf/d average exports during the first five months of 2022, mainly as a result of an unplanned outage at the Freeport LNG export facility. Freeport LNG is expected to resume partial liquefaction operations in early October 2022.
Utilization of the peak capacity at the seven U.S. LNG export facilities averaged 87% during the first half of 2022, mainly before the Freeport LNG outage, which is similar to the utilization on average during 2021.
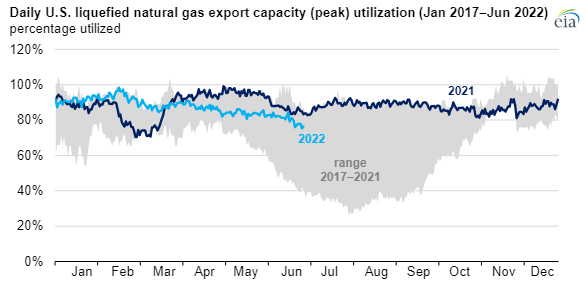
Data source: U.S. Energy Information Administration, Liquefaction Capacity Table, and U.S. Department of Energy LNG reports
Note: Daily utilization of U.S. liquefied natural gas (LNG) export capacity is calculated as a 30-day moving average.
Principal contributor: Victoria Zaretskaya