
Monthly Newsletter
July 30, 2021
Prof. ST Hsieh
Director, US-China Energy Industry Forum
626-376-7460
Introduction: This monthly newsletter is intended to be a monthly update on US-China interactions on energy and environment industry sectors. We believe that accurate, quantitative, updated data is key for decision making. Please note that data is from open sources and comments are personal opinion.
Overview:
Energy security is a national security issue, but it is also a geopolitical issue. Balance of supply and demand dominates the price and vice versa. Currently, the global demand side is clouded by the threat of COVID-19 virus and its variants. Many nations, including USA, must quickly reverse previous relaxation of pandemic control in July. It is going to negatively impact on the global recovery. Thus, global energy demand will be weak until COVID-19 pandemic is under control.
On the supply side, we notice the following issues:
- OPEC+ has reached the consensus of relaxing oil production quota, in July.
- The JCOPA negotiation with Iran is intensifying, once it is resolved, Iran will be able to export crude oil immediately. The reason is that Iran has been store crude on super tankers and they will be ready to go anytime.
- US is pulling out of Iraq at the end of 2021, if Iraq destabilized then its oil production could be severely reduced. Iraq has already asked Exxon-Mobile to leave.
- US shale oil-gas industry is slowly recovering, in general terms US shale oil industry can break even when WTI price is above US$65/bbl. When US Shale oil-gas roars back, we can expect the global oil and gas price stabilizing.
- US natural gas, including Coal Bed Methane and Shale gas, may dominate the global LNG market.
- In July, it was reported that China released three million tons of crude oil from her strategic petroleum reserve (SPR) as a tool to cool down the crude oil price. India could follow!
Background: The U.S. Energy Information Administration (EIA) is a principal agency of the U.S. Federal Statistical System responsible for collecting, analyzing, and disseminating energy information to promote sound policymaking, efficient markets, and public understanding of energy and its interaction with the economy and the environment. EIA programs cover data on coal, petroleum, natural gas, electric, renewable and nuclear energy. EIA is part of the U.S. Department of Energy.
The Department of Energy Organization Act of 1977 established EIA as the primary federal government authority on energy statistics and analysis, building upon systems and organizations first established in 1974 following the oil market disruption of 1973 due to the Arab oil embargo.
EIA conducts a comprehensive data collection program that covers the full spectrum of energy sources, end uses, and energy flows; generates short- and long-term domestic and international energy projections; and performs informative energy analyses.
EIA disseminates its data products, analyses, reports, and services to customers and stakeholders primarily through its website and the customer contact center.
Located in Washington, D.C., EIA has about 325 federal employees and a budget of $126.8 million in fiscal year 2021. Most importantly, by law, EIA’s products are prepared independently of policy considerations. EIA neither formulates nor advocates any policy conclusions. The Department of Energy Organization Act allows EIA’s processes and products to be independent from review by Executive Branch officials; specifically, Section 205(d) says:
“The Administrator shall not be required to obtain the approval of any other officer or employee of the Department in connection with the collection or analysis of any information; nor shall the Administrator be required, prior to publication, to obtain the approval of any other officer or employee of the United States with respect to the substance of any statistical or forecasting technical reports which he has prepared in accordance with law.
Some data with historical figures
- Petroleum
- 1. Weekly Petroleum Status Report (Data for Weekended: July 23, 2021)
Summary of Weekly Petroleum Data for the week ending July 23, 2021 U.S. crude oil refinery inputs averaged 15.9 million barrels per day during the week ending July 23, 2021 which was 132,000 barrels per day less than the previous week’s average. Refineries operated at 91.1% of their operable capacity last week. Gasoline production increased last week, averaging 9.8 million barrels per day. Distillate fuel production decreased last week, averaging 4.7 million barrels per day. U.S. crude oil imports averaged 6.5 million barrels per day last week (See STH Notes,) decreased by 0.6 million barrels per day from the previous week. Over the past four weeks, crude oil imports averaged about 6.4 million barrels per day, 6.9% more than the same four-week period last year. Total motor gasoline imports (including both finished gasoline and gasoline blending components) last week averaged 909,000 barrels per day, and distillate fuel imports averaged 188,000 barrels per day. U.S. commercial crude oil inventories (excluding those in the Strategic Petroleum Reserve) decreased by 4.1 million barrels from the previous week. At 435.6 million barrels, U.S. crude oil inventories are about 7% below the five year average for this time of year. Total motor gasoline inventories decreased by 2.3 million barrels last week and are about 0% below the five year average for this time of year. Finished gasoline and blending components inventories both decreased last week. Distillate fuel inventories decreased by 3.1 million barrels last week and are about 7% below the five year average for this time of year. Propane/propylene inventories increased by 1.9 million barrels last week and are about 14% below the five year average for this time of year. Total commercial petroleum inventories decreased by 6.5 million barrels last week. Total products supplied over the last four-week period averaged 20.6 million barrels a day, up by 12.6% from the same period last year. Over the past four weeks, motor gasoline product supplied averaged 9.5 million barrels a day, up by 9.1% from the same period last year. Distillate fuel product supplied averaged 3.8 million barrels a day over the past four weeks, up by 12.6% from the same period last year. Jet fuel product supplied was up 39.4% compared with the same fourweek period last year
The West Texas Intermediate crude oil price was $72.24 per barrel on July 23, 2021, $0.48 above last week’s price and $31.01 more than a year ago. The spot price for conventional gasoline in the New York Harbor was $2.292 per gallon, $0.049 more than last week’s price and $1.047 above a year ago. The spot price for ultra-low sulfur diesel fuel in the New York Harbor was $2.133 per gallon, $0.031 above last week’s price and $0.871 over a year ago. The national average retail regular gasoline price was $3.136 per gallon on July 26, 2021, $0.017 per gallon less than last week’s price but $0.961 over a year ago. The national average retail diesel fuel price was $3.342 per gallon, $0.002 below last week’s price but $0.915 over a year ago.
STH Notes: Even though the US is now a net energy exporter nation, imported heavy crudes are essential for mixing with local produced light crudes for efficient refinery operations.
- 2. Weekly Imports and Exports (Thousand Barrels Per Day)
| Download Series History Definitions, Sources & Notes | |||||||
| Show Data By: Data Series or Area | 06/18/21 | 06/25/21 | 07/02/21 | 07/09/21 | 07/16/21 | 07/23/21 | View History |
| Imports | |||||||
| Total | 9,794 | 8,760 | 8,526 | 8,658 | 9,688 | 9,259 | 1991-2021 |
| Crude Oil | 6,943 | 6,406 | 5,875 | 6,221 | 7,097 | 6,507 | 1990-2021 |
| Commercial | 6,943 | 6,406 | 5,875 | 6,221 | 7,097 | 6,507 | 1982-2021 |
| Imports by SPR | 0 | 0 | 0 | 0 | 0 | 0 | 1982-2021 |
| Imports into SPR by Others | 0 | 0 | 0 | 0 | 0 | 0 | 2010-2021 |
| Total Products | 2,852 | 2,353 | 2,652 | 2,437 | 2,591 | 2,752 | 1990-2021 |
| Total Motor Gasoline | 840 | 790 | 1,016 | 1,044 | 1,374 | 909 | 1982-2021 |
| 2 Finished Motor Gasoline | 73 | 158 | 179 | 207 | 697 | 208 | 1994-2021 |
| Reformulated | 0 | 0 | 0 | 0 | 0 | 0 | 1993-2021 |
| Blended with Fuel Ethanol | 0 | 0 | 0 | 0 | 0 | 0 | 2004-2021 |
| Other | 0 | 0 | 0 | 0 | 0 | 0 | 2004-2021 |
| Conventional | 73 | 158 | 179 | 207 | 697 | 208 | 1994-2021 |
| Blended with Fuel Ethanol | 0 | 0 | 0 | 0 | 0 | 0 | 2004-2021 |
| Ed55 and Lower | 0 | 0 | 0 | 0 | 0 | 0 | 2010-2021 |
| Greater than Ed55 | 0 | 0 | 0 | 0 | 0 | 0 | 2010-2021 |
| Other Conventional | 73 | 158 | 179 | 207 | 697 | 208 | 2004-2021 |
| Motor Gasoline Blending Components | 767 | 631 | 837 | 837 | 677 | 701 | 1985-2021 |
| RBOB | 254 | 271 | 369 | 223 | 272 | 268 | 2010-2021 |
| RBOB with Ether | 2004-2010 | ||||||
| RBOB with Alcohol | 2004-2010 | ||||||
| CBOB | 20 | 70 | 104 | 16 | 66 | 55 | 2004-2021 |
| GTAB | 249 | 97 | 175 | 117 | 109 | 33 | 2004-2021 |
| All Other | 244 | 193 | 189 | 481 | 230 | 345 | 2004-2021 |
| Fuel Ethanol | 20 | 23 | 0 | 0 | 15 | 36 | 2010-2021 |
| Kerosene-Type Jet Fuel | 281 | 108 | 136 | 117 | 129 | 279 | 1982-2021 |
| Distillate Fuel Oil | 276 | 245 | 131 | 77 | 87 | 188 | 1982-2021 |
| 15 ppm Sulfur and Under | 276 | 245 | 86 | 77 | 87 | 188 | 2004-2021 |
| > 15 ppm to 500 ppm Sulfur | 0 | 0 | 0 | 0 | 0 | 0 | 1993-2021 |
| > 500 ppm to 2000 ppm Sulfur | 0 | 0 | 45 | 0 | 0 | 0 | 2004-2021 |
| > 2000 ppm Sulfur | 0 | 0 | 0 | 0 | 0 | 0 | 2004-2021 |
| Residual Fuel Oil | 235 | 125 | 113 | 102 | 118 | 176 | 1982-2021 |
| Propane/Propylene | 77 | 103 | 70 | 81 | 96 | 88 | 2004-2021 |
| Other Oils | 1,124 | 961 | 1,186 | 1,016 | 771 | 1,076 | 2010-2021 |
| Kerosene | 0 | 0 | 0 | 0 | 0 | 20 | 2010-2021 |
| NGPLs/LRGs (Excluding Propane/Propylene) | 38 | 34 | 40 | 37 | 38 | 31 | 2010-2021 |
| Exports | |||||||
| Total Crude Oil and Products | 9,133 | 8,711 | 7,828 | 9,620 | 7,985 | 8,144 | 1991-2021 |
| Crude Oil | 3,651 | 3,717 | 2,628 | 4,025 | 2,463 | 2,489 | 1991-2021 |
| Products | 5,482 | 4,994 | 5,200 | 5,595 | 5,522 | 5,655 | 1991-2021 |
| Finished Motor Gasoline | 895 | 446 | 848 | 747 | 866 | 718 | 2010-2021 |
| Kerosene-Type Jet Fuel | 140 | 55 | 61 | 137 | 88 | 61 | 2010-2021 |
| Distillate Fuel Oil | 1,190 | 1,228 | 1,027 | 1,316 | 1,257 | 1,012 | 2010-2021 |
| Residual Fuel Oil | 155 | 155 | 131 | 205 | 85 | 139 | 2010-2021 |
| Propane/Propylene | 1,182 | 1,213 | 1,139 | 1,071 | 1,186 | 1,531 | 2010-2021 |
| Other Oils | 1,920 | 1,897 | 1,994 | 2,119 | 2,040 | 2,194 | 2010-2021 |
| Net Imports | |||||||
| Total | 661 | 49 | 698 | -962 | 1,703 | 1,115 | 1991-2021 |
| Crude Oil | 3,292 | 2,689 | 3,247 | 2,196 | 4,634 | 4,018 | 2001-2021 |
| Products | -2,630 | -2,641 | -2,548 | -3,158 | -2,931 | -2,903 | 2001-2021 |
Notes: RBOB with Ether and RBOB with Alcohol are discontinued as of the week ending June 4, 2010 reporting period. Due to independent rounding, individual product detail may not add to total. See Definitions, Sources, and Notes link above for more information on this table.
Release Date: 7/28/2021
- 3. Spot Prices (Crude Oil in US Dollars per Barrel, products per Gallon)
| Download Series History Definitions, Sources & Notes | |||||||
| Product by Area | 07/19/21 | 07/20/21 | 07/21/21 | 07/22/21 | 07/23/21 | 07/26/21 | View History |
| Crude Oil | |||||||
| WTI – Cushing, Oklahoma | 66.45 | 67.32 | 70.26 | 72.15 | 72.24 | 72.15 | 1986-2021 |
| Brent – Europe | 69.33 | 70.03 | 72.54 | 74.25 | 74.86 | 74.79 | 1987-2021 |
| Conventional Gasoline | |||||||
| New York Harbor, Regular | 2.112 | 2.139 | 2.215 | 2.264 | 2.292 | 2.319 | 1986-2021 |
| U.S. Gulf Coast, Regular | 2.055 | 2.069 | 2.145 | 2.197 | 2.210 | 2.237 | 1986-2021 |
| RBOB Regular Gasoline | |||||||
| Los Angeles | 2.192 | 2.224 | 2.305 | 2.364 | 2.412 | 2.439 | 2003-2021 |
| No. 2 Heating Oil | |||||||
| New York Harbor | 1.810 | 1.839 | 1.906 | 1.949 | 1.955 | 1.978 | 1986-2021 |
| Ultra-Low-Sulfur No. 2 Diesel Fuel | |||||||
| New York Harbor | 1.984 | 2.015 | 2.084 | 2.127 | 2.133 | 2.156 | 2006-2021 |
| U.S. Gulf Coast | 1.932 | 1.956 | 2.029 | 2.072 | 2.079 | 2.102 | 2006-2021 |
| Los Angeles | 1.997 | 2.026 | 2.121 | 2.159 | 2.170 | 2.193 | 1996-2021 |
| Kerosene-Type Jet Fuel | |||||||
| U.S. Gulf Coast | 1.747 | 1.846 | 1.839 | 1.886 | 1.890 | 1.913 | 1990-2021 |
| Propane | |||||||
| Mont Belvieu, Texas | 1.048 | 1.038 | 1.065 | 1.085 | 1.088 | 1.090 | 1992-2021 |
Notes: Weekly, monthly, and annual prices are calculated by EIA from daily data by taking an unweighted average of the daily closing spot prices for a given product over the specified time period. See Definitions, Sources, and Notes link above for more information on this table.
Release Date: 7/28/2021
- 4. Exports by Destination
| Download Series History Definitions, Sources & Notes | |||||||
| Show Data By: Destination or Product | Dec-20 | Jan-21 | Feb-21 | Mar-21 | Apr-21 | May-21 | View History |
| Total All Countries | 3,371 | 3,165 | 2,703 | 2,685 | 3,283 | 2,736 | 1920-2021 |
| Argentina | 0 | 2016-2021 | |||||
| Australia | 48 | 27 | 24 | 2018-2021 | |||
| Bahama Islands | 2016-2020 | ||||||
| Belarus | 2020-2020 | ||||||
| Belgium | 26 | 17 | 2019-2021 | ||||
| Brazil | 28 | 80 | 106 | 146 | 14 | 2015-2021 | |
| British Indian Ocean Territory | 2017-2017 | ||||||
| Bulgaria | 2019-2019 | ||||||
| Cameroon | 2004-2004 | ||||||
| Canada | 384 | 363 | 297 | 337 | 354 | 272 | 1993-2021 |
| Chile | 24 | 44 | 27 | 23 | 50 | 2018-2021 | |
| China | 719 | 390 | 269 | 339 | 202 | 350 | 1996-2021 |
| Colombia | 18 | 18 | 20 | 21 | 35 | 2016-2021 | |
| Costa Rica | 2011-2011 | ||||||
| Croatia | 2018-2020 | ||||||
| Curacao | 2016-2018 | ||||||
| Denmark | 23 | 23 | 66 | 4 | 2017-2021 | ||
| Dominican Republic | 16 | 16 | 35 | 16 | 33 | 16 | 2016-2021 |
| Finland | 24 | 2020-2020 | |||||
| France | 71 | 71 | 104 | 92 | 48 | 50 | 2005-2021 |
| Georgia, Republic of | 2017-2017 | ||||||
| Germany | 69 | 48 | 81 | 49 | 85 | 107 | 2004-2021 |
| Gibraltar | 2017-2020 | ||||||
| Greece | 2016-2020 | ||||||
| Guatemala | 2016-2016 | ||||||
| Hong Kong | 1996-2017 | ||||||
| India | 560 | 463 | 463 | 344 | 370 | 361 | 2015-2021 |
| Indonesia | 22 | 2019-2021 | |||||
| Ireland | 39 | 39 | 22 | 22 | 22 | 2018-2021 | |
| Israel | 2016-2020 | ||||||
| Italy | 120 | 94 | 80 | 74 | 138 | 144 | 2014-2021 |
| Jamaica | 2019-2019 | ||||||
| Japan | 33 | 25 | 43 | 1996-2021 | |||
| Korea, South | 260 | 319 | 247 | 398 | 348 | 239 | 1993-2021 |
| Liberia | 2016-2016 | ||||||
| Lithuania | 48 | 24 | 2019-2021 | ||||
| Malaysia | 2017-2020 | ||||||
| Malta | 2020-2020 | ||||||
| Marshall Islands | 2016-2020 | ||||||
| Martinique | 18 | 2021-2021 | |||||
| Mexico | 1996-2019 | ||||||
| Netherlands | 260 | 137 | 462 | 193 | 425 | 245 | 2004-2021 |
| Netherlands/Antilles | 2004-2004 | ||||||
| New Zealand | 2020-2020 | ||||||
| Nicaragua | 12 | 12 | 12 | 9 | 2016-2021 | ||
| Nigeria | 2016-2016 | ||||||
| Norway | 24 | 46 | 26 | 23 | 77 | 2017-2021 | |
| Panama | 43 | 45 | 2016-2021 | ||||
| Peru | 23 | 13 | 46 | 13 | 13 | 2016-2021 | |
| Philippines | 2019-2019 | ||||||
| Poland | 23 | 2017-2021 | |||||
| Portugal | 25 | 24 | 23 | 2018-2021 | |||
| Puerto Rico | 1993-1996 | ||||||
| Russia | 2004-2004 | ||||||
| St. Lucia | 2020-2020 | ||||||
| Singapore | 97 | 130 | 66 | 217 | 105 | 2014-2021 | |
| South Africa | 26 | 2016-2021 | |||||
| Spain | 23 | 96 | 26 | 46 | 75 | 23 | 2014-2021 |
| Sweden | 46 | 23 | 24 | 2018-2021 | |||
| Switzerland | 23 | 21 | 25 | 24 | 2014-2021 | ||
| Taiwan | 47 | 192 | 25 | 305 | 211 | 208 | 1996-2021 |
| Thailand | 101 | 128 | 85 | 2016-2021 | |||
| Togo | 2017-2017 | ||||||
| Trinidad and Tobago | 2017-2017 | ||||||
| Turkey | 2017-2017 | ||||||
| Ukraine | 2020-2020 | ||||||
| United Arab Emirates | 25 | 2017-2020 | |||||
| United Kingdom | 284 | 224 | 100 | 197 | 290 | 232 | 2016-2021 |
| Uruguay | 2018-2020 | ||||||
| Venezuela | 1998-1998 | ||||||
| Vietnam | 22 | 18 | 1996-2021 | ||||
| Virgin Islands (U.S.) | 89 | 51 | 71 | 47 | 23 | 1993-2021 | |
Notes: On December 18, 2015, the U.S. enacted legislation authorizing the export of U.S. crude oil without a license. Exports to embargoed or sanctioned countries continue to require authorization. Prior to December 2015, crude oil exports were restricted to: (1) crude oil derived from fields under the State waters of Cook Inlet of Alaska; (2) Alaskan North Slope crude oil; (3) certain domestically produced crude oil destined for Canada; (4) shipments to U.S. territories; and (5) California crude oil to Pacific Rim countries. Totals may not equal sum of components due to independent rounding. See Definitions, Sources, and Notes link above for more information on this table.
Release Date: 7/30/2021
ST Notes: The data shows that US crude exports to China during the past half year experienced a large (almost 50%) reduction after President Biden took over from President Trump. The decrease could also be attributed to elevated crude oil price and slow global recovery from the COVID-19 pandemic. So there are plenty room for US-China crude oil trade to expand.
- Natural Gas
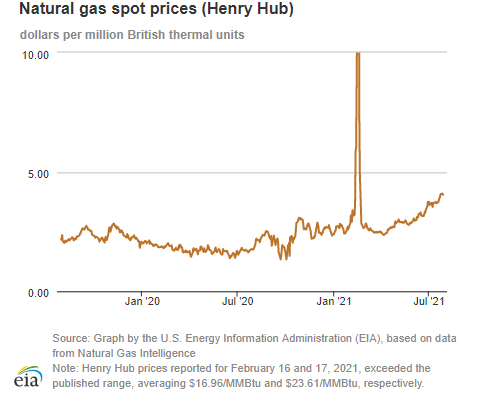
STH Note: The spike of natural gas price on February 16 and 17, 2021 was due to the severe winter weather hitting Texas caused the collapsing of its energy supply network
- 1. U.S. natural gas supply Week: (7/22/21 – 7/28/21)
| this week | last week | last year | |
| Marketed production | 104.5 | 105.0 | 101.2 |
| Dry production | 92.6 | 92.9 | 89.6 |
| Net Canada imports | 5.6 | 5.0 | 4.1 |
| LNG pipeline deliveries | 0.1 | 0.1 | 0.2 |
| Total supply | 98.3 | 98.0 | 93.9 |
Source: Chart by the U.S. Energy Information Administration (EIA), based on data from IHS Markit
Note: This table reflects any data revisions that may have occurred since the previous week’s posting. Liquefied natural gas (LNG) pipeline deliveries represent natural gas sendout from LNG import terminals.
U.S. LNG exports decrease week over week. Nineteen LNG vessels (seven from Sabine Pass, four from Corpus Christi, three each from Cameron and Freeport, and two from Cove Point) with a combined LNG-carrying capacity of 70 Bcf departed the United States between July 22 and July 28, 2021, according to shipping data provided by Bloomberg Finance, L.P.
- 2. U.S. Natural Gas Exports and Re-Exports by Country (Volumes in Million Cubic Feet, Prices in US Dollars per Thousand Cubic Feet)
| Download Series History Definitions, Sources & Notes | |||||||
| Type – Area | Dec-20 | Jan-21 | Feb-21 | Mar-21 | Apr-21 | May-21 | View History |
| Export Volumes | |||||||
| Total | 553,176 | 563,483 | 423,972 | 595,375 | 560,890 | 574,501 | 1973-2021 |
| Pipeline | 248,884 | 258,287 | 215,579 | 274,352 | 254,072 | 259,579 | 1997-2021 |
| Canada | 84,307 | 84,927 | 78,198 | 91,301 | 74,567 | 70,561 | 1973-2021 |
| Mexico | 164,577 | 173,360 | 137,381 | 183,051 | 179,505 | 189,018 | 1973-2021 |
| LNG | 304,263 | 305,196 | 208,394 | 321,023 | 306,818 | 314,922 | 1997-2021 |
| Exports | 304,263 | 305,196 | 208,394 | 321,023 | 306,818 | 314,922 | 2014-2021 |
| By Vessel | 304,209 | 305,113 | 208,331 | 321,004 | 306,755 | 314,855 | 2013-2021 |
| Argentina | 0 | 0 | 0 | 2,238 | 4,485 | 16,226 | 2015-2021 |
| Bahamas | 36 | 28 | 29 | 39 | 46 | 45 | 2017-2021 |
| Bangladesh | 0 | 3,148 | 0 | 3,566 | 10,219 | 6,948 | 2019-2021 |
| Barbados | 25 | 17 | 19 | 14 | 30 | 19 | 2015-2021 |
| Belgium | 0 | 0 | 0 | 3,484 | 0 | 2,100 | 2018-2021 |
| Brazil | 29,927 | 21,132 | 13,118 | 21,977 | 11,615 | 19,726 | 2015-2021 |
| Chile | 9,793 | 9,784 | 6,524 | 21,320 | 10,293 | 17,598 | 2015-2021 |
| China | 45,525 | 38,940 | 3,415 | 28,476 | 46,837 | 37,731 | 2011-2021 |
| Colombia | 0 | 0 | 0 | 0 | 892 | 0 | 2017-2021 |
| Croatia | 3,275 | 0 | 0 | 7,367 | 3,666 | 3,364 | 2020-2021 |
| Dominican Republic | 5,000 | 6,895 | 5,689 | 5,577 | 2,905 | 5,283 | 2016-2021 |
| Egypt | 0 | 0 | 0 | 0 | 0 | 0 | 2016-2021 |
| France | 3,752 | 3,587 | 14,851 | 33,678 | 36,120 | 11,926 | 2018-2021 |
| Greece | 3,382 | 600 | 0 | 6,805 | 0 | 6,796 | 2018-2021 |
| Haiti | 17 | 12 | 11 | 10 | 3 | 12 | 2018-2021 |
| India | 10,241 | 20,367 | 13,776 | 17,381 | 13,752 | 28,259 | 2015-2021 |
| Israel | 0 | 0 | 0 | 2,826 | 3,225 | 0 | 2017-2021 |
| Italy | 0 | 0 | 0 | 10,739 | 6,896 | 2,923 | 2016-2021 |
| Jamaica | 2,374 | 3,708 | 2,365 | 2,458 | 2,370 | 2,925 | 2018-2021 |
| Japan | 54,004 | 64,331 | 18,271 | 27,673 | 28,756 | 25,058 | 1973-2021 |
| Jordan | 0 | 0 | 0 | 0 | 0 | 0 | 2016-2021 |
| Kuwait | 0 | 0 | 0 | 3,821 | 3,705 | 0 | 2016-2021 |
| Lithuania | 6,291 | 0 | 6,851 | 3,228 | 3,078 | 3,049 | 2017-2021 |
| Malaysia | 2019-2019 | ||||||
| Malta | 0 | 0 | 0 | 0 | 2,928 | 0 | 2016-2021 |
| Mexico | 0 | 0 | 13,354 | 0 | 0 | 0 | 2016-2021 |
| Netherlands | 3,316 | 2,949 | 22,777 | 24,204 | 17,060 | 26,611 | 2016-2021 |
| Pakistan | 0 | 3,682 | 0 | 3,421 | 3,323 | 0 | 2016-2021 |
| Panama | 271 | 516 | 0 | 3,279 | 0 | 2,341 | 2017-2021 |
| Poland | 7,033 | 0 | 7,099 | 3,507 | 7,382 | 3,581 | 2016-2021 |
| Portugal | 3,711 | 0 | 3,360 | 0 | 7,358 | 10,765 | 2015-2021 |
| Russia | 0 | 0 | 0 | 0 | 0 | 0 | 2007-2021 |
| Singapore | 0 | 3,688 | 0 | 3,303 | 7,297 | 3,089 | 2018-2021 |
| South Korea | 39,617 | 55,936 | 18,094 | 32,203 | 21,683 | 46,033 | 2016-2021 |
| Spain | 13,583 | 7,377 | 3,733 | 13,900 | 22,974 | 5,234 | 2016-2021 |
| Taiwan | 12,470 | 10,319 | 0 | 13,450 | 6,594 | 10,157 | 2015-2021 |
| Thailand | 0 | 0 | 0 | 0 | 7,388 | 3,453 | 2016-2021 |
| Turkey | 20,188 | 26,659 | 20,652 | 3,619 | 0 | 3,017 | 2016-2021 |
| United Arab Emirates | 0 | 0 | 0 | 0 | 0 | 0 | 2015-2021 |
| United Kingdom | 30,378 | 21,436 | 34,343 | 17,440 | 13,877 | 10,586 | 2017-2021 |
| By Truck | 53 | 83 | 63 | 19 | 63 | 66 | 2013-2021 |
| Canada | 8 | 0 | 0 | 0 | 15 | 18 | 2007-2021 |
| Mexico | 46 | 83 | 63 | 19 | 48 | 48 | 1997-2021 |
| Re-Exports | 0 | 0 | 0 | 0 | 0 | 0 | 2013-2021 |
| Argentina | 0 | 0 | 0 | 0 | 0 | 0 | 2016-2021 |
| Brazil | 0 | 0 | 0 | 0 | 0 | 0 | 2010-2021 |
| Chile | 2011-2016 | ||||||
| China | 0 | 0 | 0 | 0 | 0 | 0 | 2011-2021 |
| Egypt | 0 | 0 | 0 | 0 | 0 | 0 | 2015-2021 |
| India | 0 | 0 | 0 | 0 | 0 | 0 | 2010-2021 |
| Japan | 0 | 0 | 0 | 0 | 0 | 0 | 2010-2021 |
| Mexico | 0 | 0 | 0 | 0 | 0 | 0 | 2012-2021 |
| Portugal | 2012-2016 | ||||||
| South Korea | 0 | 0 | 0 | 0 | 0 | 0 | 2009-2021 |
| Spain | 0 | 0 | 0 | 0 | 0 | 0 | 2010-2021 |
| Turkey | 0 | 0 | 0 | 0 | 0 | 0 | 2015-2021 |
| United Kingdom | 0 | 0 | 0 | 0 | 0 | 0 | 2010-2021 |
| CNG | 29 | 0 | 0 | 0 | 0 | 0 | 2011-2021 |
| Canada | 29 | 0 | 0 | 0 | 0 | 0 | 2011-2021 |
| Export Prices | |||||||
| Average | 4.84 | 4.62 | 12.68 | 4.71 | 4.47 | 4.91 | 1989-2021 |
| Pipeline | 2.85 | 2.89 | 18.64 | 2.91 | 2.72 | 3.02 | 1997-2021 |
| Canada | 2.80 | 2.99 | 4.03 | 2.86 | 2.58 | 2.84 | 1989-2021 |
| Mexico | 2.87 | 2.84 | 26.96 | 2.93 | 2.78 | 3.09 | 1989-2021 |
| LNG | 6.48 | 6.08 | 6.52 | 6.25 | 5.92 | 6.46 | 1997-2021 |
| Exports | 6.48 | 6.08 | 6.52 | 6.25 | 5.92 | 6.46 | 2014-2021 |
| By Vessel | 6.48 | 6.08 | 6.51 | 6.25 | 5.92 | 6.46 | 2013-2021 |
| Argentina | — | — | — | 6.55 | 6.25 | 6.11 | 2015-2021 |
| Bahamas | 10.39 | 10.39 | 10.39 | 10.39 | 10.39 | 10.39 | 2017-2021 |
| Bangladesh | — | 2.95 | — | 6.07 | 5.56 | 7.01 | 2019-2021 |
| Barbados | 10.39 | 10.39 | 10.39 | 10.39 | 10.39 | 10.39 | 2015-2021 |
| Belgium | — | — | — | 4.65 | — | 7.35 | 2018-2021 |
| Brazil | 6.59 | 7.35 | 7.51 | 6.53 | 5.81 | 6.08 | 2015-2021 |
| Chile | 5.99 | 5.91 | 6.97 | 6.15 | 5.95 | 6.55 | 2015-2021 |
| China | 6.33 | 6.09 | 4.46 | 6.39 | 5.76 | 6.43 | 2011-2021 |
| Colombia | — | — | — | — | 6.25 | — | 2017-2021 |
| Croatia | 6.75 | — | — | 6.58 | 6.25 | 6.67 | 2020-2021 |
| Dominican Republic | 6.32 | 6.23 | 8.99 | 6.14 | 5.90 | 6.59 | 2016-2021 |
| Egypt | — | — | — | — | — | — | 2016-2021 |
| France | 7.12 | 6.09 | 6.72 | 6.75 | 5.76 | 6.95 | 2018-2021 |
| Greece | 6.08 | 5.56 | — | 5.33 | — | 6.11 | 2018-2021 |
| Haiti | 10.39 | 10.39 | 10.39 | 10.39 | 10.39 | 10.39 | 2018-2021 |
| India | 6.33 | 6.10 | 6.62 | 6.07 | 5.48 | 6.36 | 2015-2021 |
| Israel | — | — | — | 6.46 | 5.11 | — | 2017-2021 |
| Italy | — | — | — | 6.65 | 6.88 | 6.11 | 2016-2021 |
| Jamaica | 6.27 | 6.09 | 6.43 | 6.55 | 6.22 | 6.63 | 2018-2021 |
| Japan | 6.78 | 6.20 | 6.60 | 7.01 | 6.06 | 6.94 | 1973-2021 |
| Jordan | — | — | — | — | — | — | 2016-2021 |
| Kuwait | — | — | — | 6.64 | 5.75 | — | 2016-2021 |
| Lithuania | 6.28 | — | 6.14 | 7.08 | 6.16 | 6.61 | 2017-2021 |
| Malaysia | 2019-2019 | ||||||
| Malta | — | — | — | — | 6.22 | — | 2016-2021 |
| Mexico | — | — | 5.68 | — | — | — | 2015-2021 |
| Netherlands | 8.37 | 5.57 | 5.87 | 5.81 | 6.18 | 6.30 | 2016-2021 |
| Pakistan | — | 4.54 | — | 8.42 | 6.00 | — | 2016-2021 |
| Panama | 6.08 | 6.09 | — | 6.07 | — | 7.35 | 2017-2021 |
| Poland | 7.25 | — | 6.95 | 6.55 | 6.15 | 6.61 | 2016-2021 |
| Portugal | 7.12 | — | 5.37 | — | 5.96 | 4.70 | 2015-2021 |
| Russia | — | — | — | — | — | — | 2007-2021 |
| Singapore | — | 6.11 | — | 4.37 | 4.77 | 6.67 | 2018-2021 |
| South Korea | 6.20 | 6.01 | 6.64 | 5.48 | 6.21 | 6.81 | 2016-2021 |
| Spain | 6.94 | 6.31 | 6.48 | 5.95 | 6.34 | 6.77 | 2015-2021 |
| Taiwan | 6.19 | 5.17 | — | 5.59 | 5.42 | 6.65 | 2015-2021 |
| Thailand | — | — | — | — | 4.08 | 6.66 | 2016-2021 |
| Turkey | 6.22 | 6.13 | 7.00 | 6.59 | — | 6.42 | 2016-2021 |
| United Arab Emirates | — | — | — | — | — | — | 2015-2021 |
| United Kingdom | 6.23 | 5.74 | 6.16 | 6.47 | 6.91 | 5.78 | 2017-2021 |
| By Truck | 8.67 | 9.16 | 9.52 | 10.39 | 11.53 | 10.71 | 2013-2021 |
| Canada | 9.99 | — | — | — | 11.14 | 11.34 | 2007-2021 |
| Mexico | 8.45 | 9.16 | 9.52 | 10.39 | 11.66 | 10.47 | 1992-2021 |
| Re-Exports | — | — | — | — | — | — | 2013-2021 |
| Argentina | — | — | — | — | — | — | 2015-2021 |
| Brazil | — | — | — | — | — | — | 2010-2021 |
| Chile | 2011-2016 | ||||||
| China | — | — | — | — | — | — | 2011-2021 |
| Egypt | — | — | — | — | — | — | 2015-2021 |
| India | — | — | — | — | — | — | 2010-2021 |
| Japan | — | — | — | — | — | — | 2010-2021 |
| Mexico | — | — | — | — | — | — | 2012-2021 |
| Portugal | 2012-2016 | ||||||
| South Korea | — | — | — | — | — | — | 2009-2021 |
| Spain | — | — | — | — | — | — | 2010-2021 |
| Turkey | — | — | — | — | — | — | 2015-2021 |
| United Kingdom | — | — | — | — | — | — | 2010-2021 |
| CNG | 3.81 | — | — | — | — | — | 2011-2021 |
| Canada | 3.81 | — | — | — | — | — | 2011-2021 |
Notes: The price of LNG exports to Japan is the “landed” price, defined as received at the terminal in Japan. CNG = Compressed Natural Gas: Natural gas compressed to a pressure at or above 200-248 bar (i.e., 2900-3600 pounds per square inch) and stored in high-pressure containers. LNG re-exports are shipments of LNG to foreign countries that were previously imported, offloaded. See Definitions, Sources, and Notes link above for more information on this table.
Release Date: 7/30/2021
STH Notes:
- From the US data, it seems that the US-China LNG trade has been steady for the past half year, as of May 2021 (last data available) China Imported 37,731 Million Cubic Feet over the US total of 314,992 Million Cubic Feet or almost 12%. China’ import is only next to South Korea which is at about 15%. Overall, Asia is the major destination of US LNG at 37.7%.
- China’s import price at US$6.43 per Thousand Cubic Feet which is rather fair as Japan must pay US$ 6.94 and South Korea must pay US$6.91 respectively.
- Further, the US data shows that there is no Re-Exports anywhere in the world. It seems that LNG spot market is not well developed.
Conclusions: More LNG activities are expected.
Contact Information
Cell phone: 6262-276-7460
Email: [email protected]